The business ontology your AI actually needs.
Magnus, our AI ontologist, helps your team assemble a shared, governed ontology of your business. Maggie, your AI data analyst, grounds every answer in it. The same ontology then reads into every other AI tool you deploy next — starting with the coding agents your engineers already use.

Maggie — AI data analyst

Magnus — AI ontologist
What an ontology unlocks
Four things you get once you have a shared business ontology — no matter which AI reads it next.
Trustworthy AI answers.
Every number traces back to a defined metric, a mapped column, and the exact SQL. No hallucinated fields.
One shared definition of the business.
Revenue, churn, MQL — defined once, used by every dashboard, agent, and report.
Governance by construction.
Who sees which metrics, which rows, which columns — declared in the ontology, enforced on every query.
A context layer that outlives any one tool.
Built on open standards. Readable by Magnowlia today and any AI agent tomorrow.
Not just a semantic layer.
Traditional semantic layers were built for BI tools. Magnowlia was built for the AI you're deploying next.
- Built for AI, not just BI tools.
- Traditional semantic layers
Traditional layers expose metrics as an API for dashboards.
MagnowliaMagnowlia's ontology is a context layer AI agents read directly — with full lineage from answer back to the definition you control.
- Active, not passive.
- Traditional semantic layers
Traditional layers store what you wrote down.
MagnowliaMagnowlia also proposes: imports from your existing docs, discovers correlations between your metrics, surfaces things you didn't know to define.
- Open standards you own.
- Traditional semantic layers
LookML, Cube, dbt Semantic Layer — each a proprietary definition language locked to one vendor. Leave the vendor, rewrite the definitions.
MagnowliaYour ontology is built on open W3C standards — a plain file you commit alongside your code. Outlives any one tool.
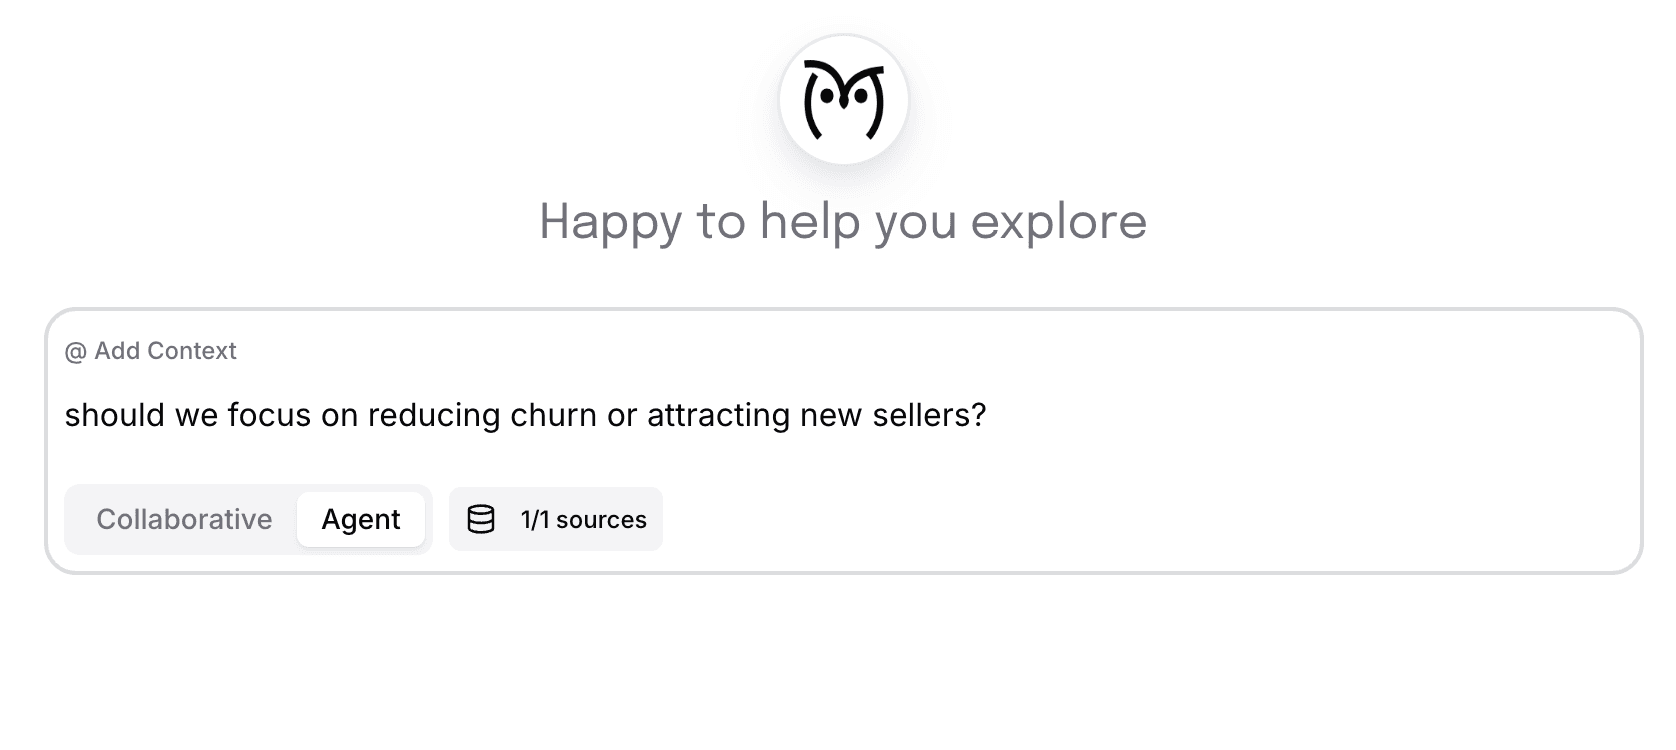
Ask the questions that trigger action.
Magnowlia uses your ontology to explore, not just look up. Ask open-ended questions, compare segments, follow relationships you didn’t know to query — and stay grounded in the definitions you control, with full lineage on every answer.
How It Works
Connect your data
Link your data warehouses and semantic layers in minutes. Magnowlia supports BigQuery, Snowflake, PostgreSQL, Redshift, and semantic tools like dbt, Cube, and Steep. A built-in step-by-step guide walks you through each connection type with field-level help and automatic connection testing.
Assemble your ontology with Magnus
Upload dbt manifests, Cube YAML, or even PDF, Excel, or Word data dictionaries. Magnus proposes concrete changes to your ontology; you review and apply. Version-controlled from day one.
Ask, govern, discover
Ask questions and get grounded, traceable answers. Row-level security enforced automatically. Magnowlia also surfaces correlations between your metrics so you see how the business moves as a whole.
Ontology-native capabilities
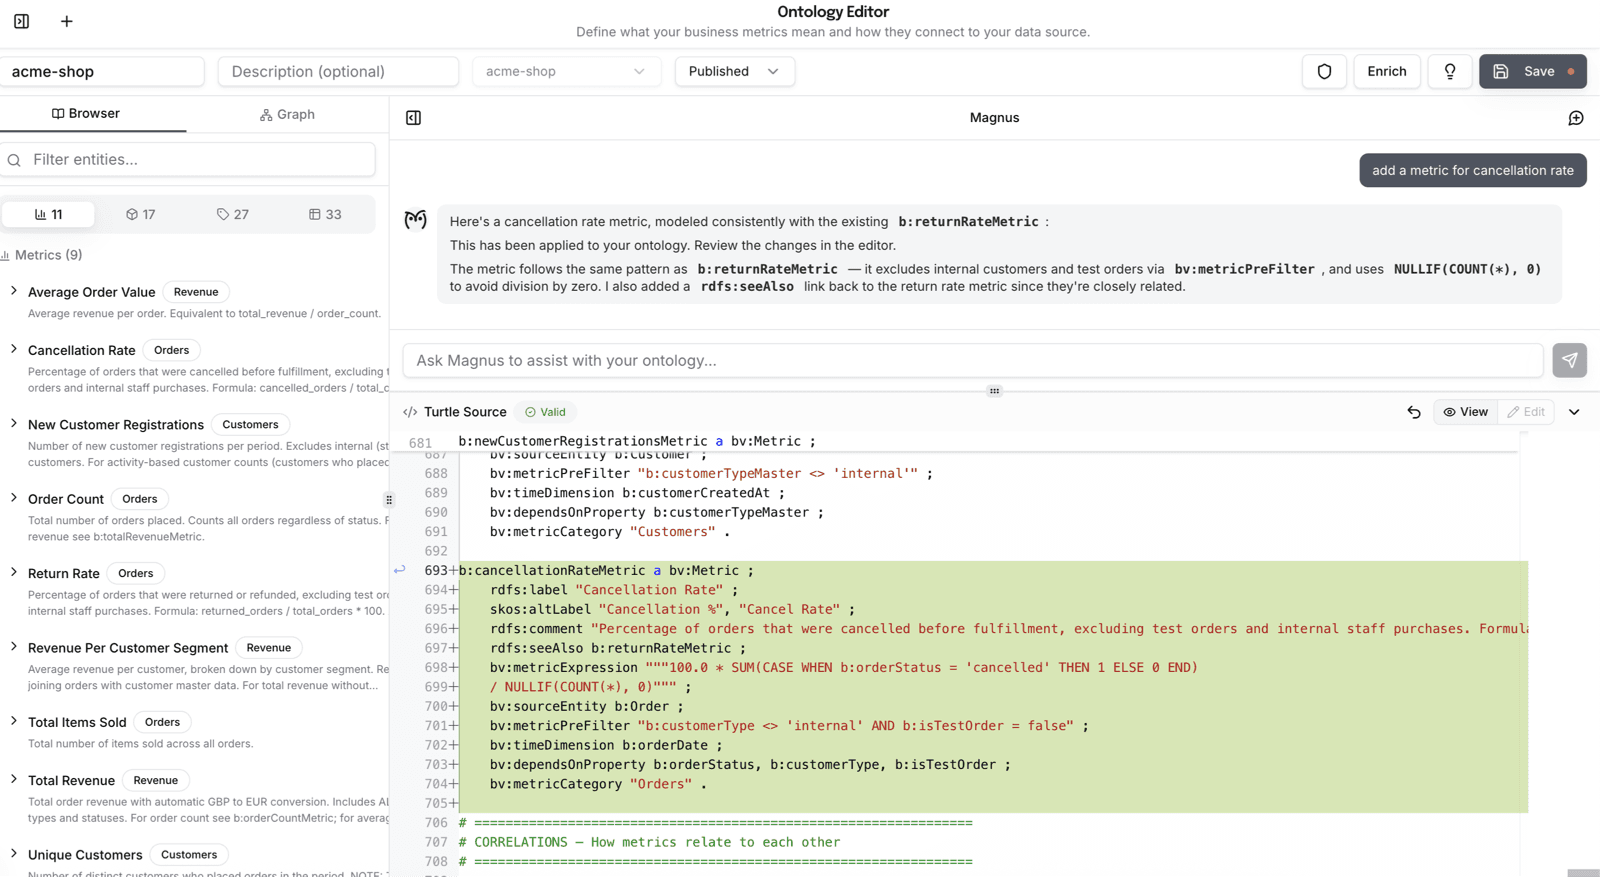
Model your business with an AI partner.
Magnus drafts your ontology, maps it to your database, and opens pull-request-style diffs you approve. Drop in dbt, Cube, Excel, PDF or Word docs — Magnus reads them and proposes concrete changes with their source. Every change is version-controlled.
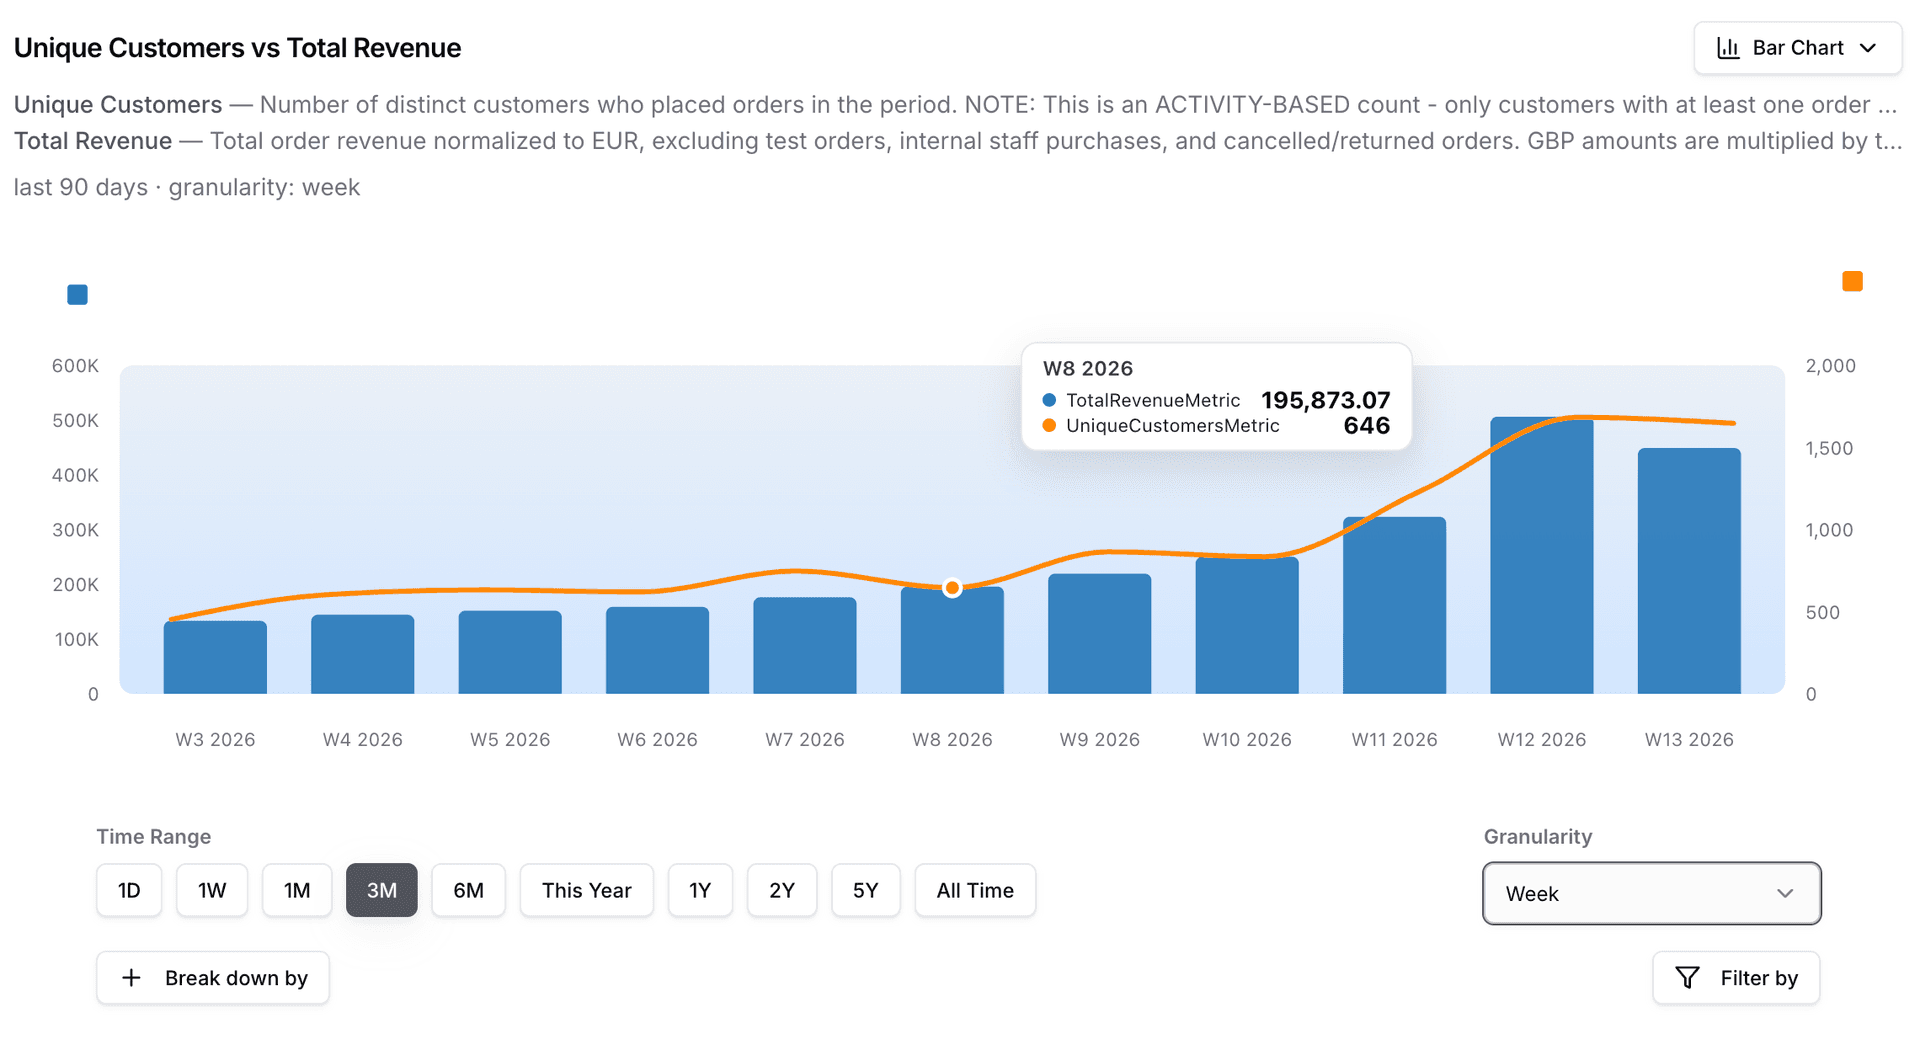
Grounded answers. Portable to any AI.
Every number is grounded in a metric defined in your ontology — no hallucinated columns, no silent assumptions, with the definition travelling alongside the answer. Combine metrics on the same chart, break down by any dimension, filter by any attribute. And because the ontology is built on open standards, the same grounding carries into any agent you plug in tomorrow.
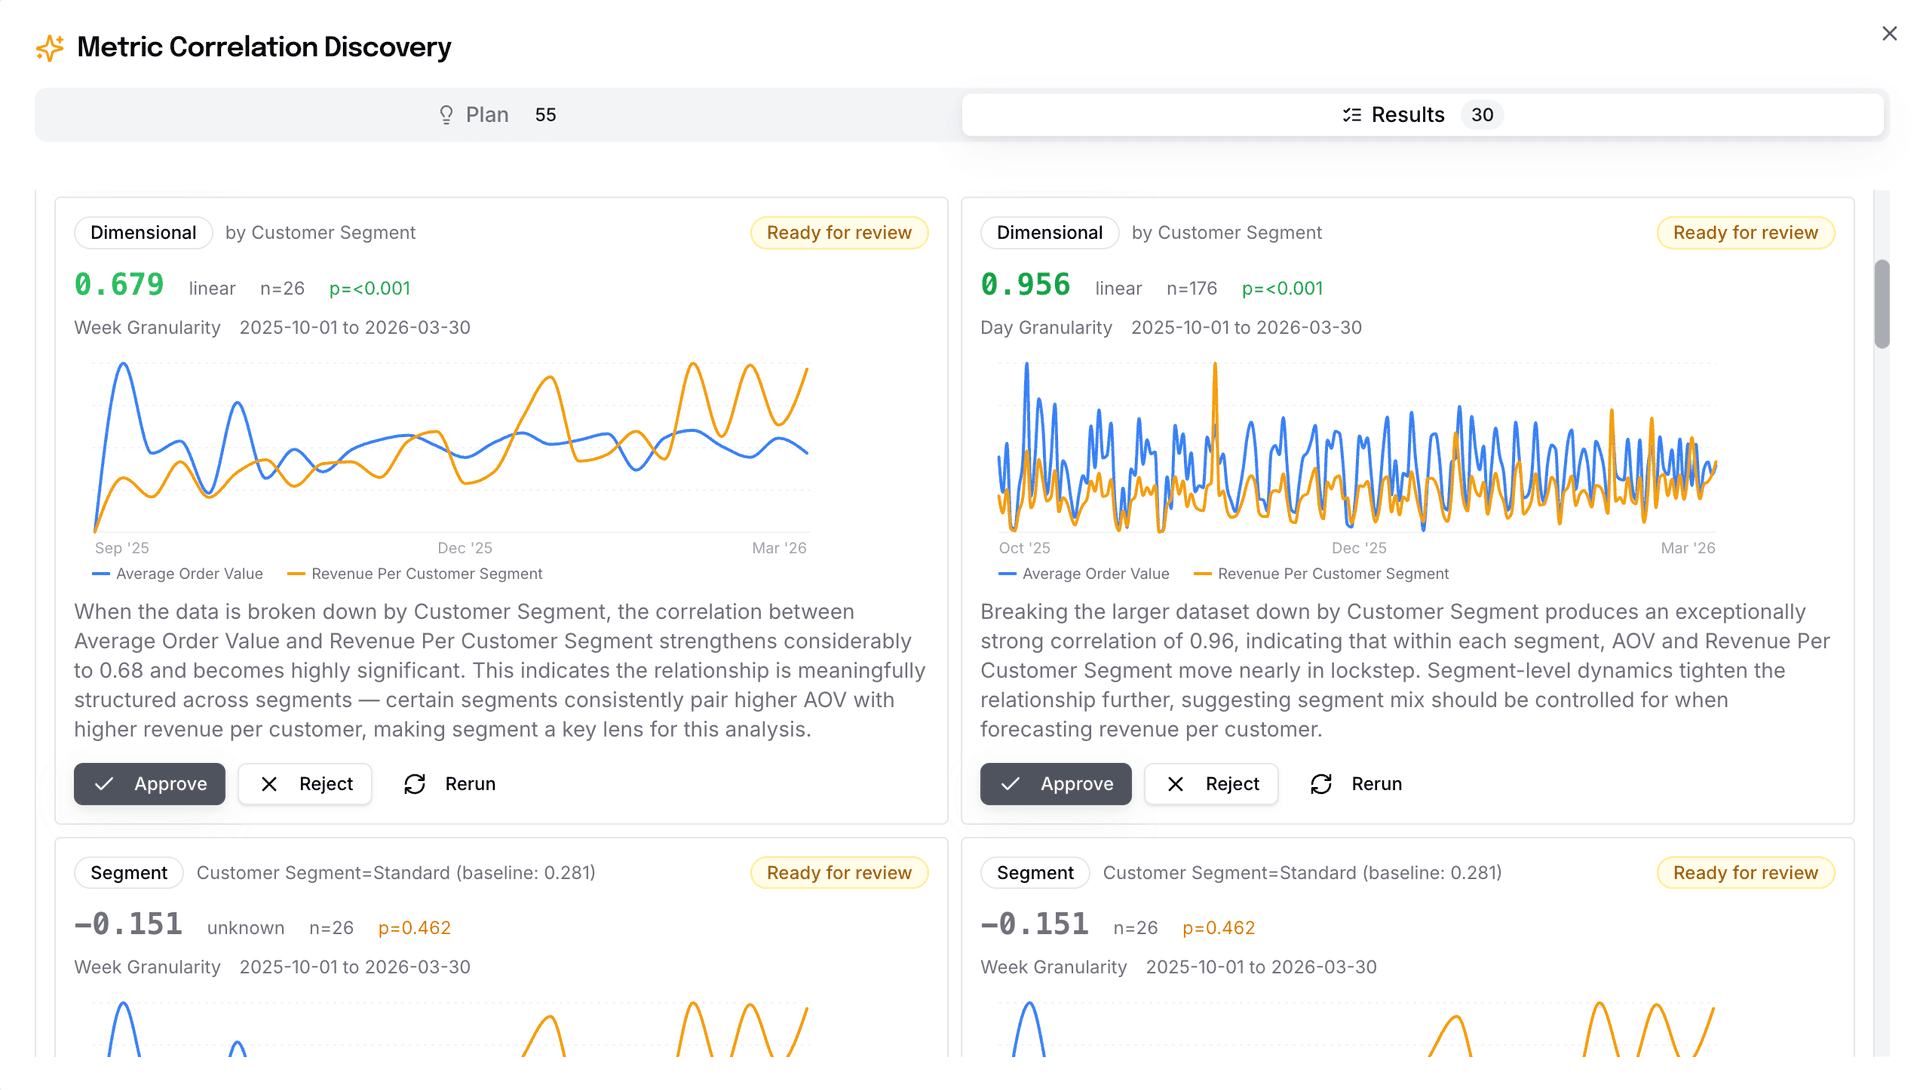
Correlations, discovered for you.
Magnowlia walks through the metrics in your ontology, runs the statistical analyses across dimensions and segments, and ranks findings by business relevance. You get a shortlist of meaningful relationships — including where a correlation strengthens or reverses for a particular segment — ready to approve into the ontology as shared facts.
Governance, declared in your ontology.
Who can see which metrics, which rows, which columns — declared in the ontology alongside the definitions they protect. Rules render per user automatically. Maggie sees only what each person is allowed to see, with no special-case code.
Your ontology, everywhere your AI is.
You built it once to ground your analytics. The same ontology grounds every other AI at your company — starting with the one your engineers already use.
Magnowlia analytics
The onboarding path. Connect your warehouse, model your business, start asking questions. Every other consumer below comes with zero extra work.
Claude Code + coding agents
Commit your ontology into the repo your engineers work in. Point Claude Code at the file. Generated application code references the same metric definitions, inherits access rules, and propagates refactors across services — all without anyone re-encoding “what does revenue mean” by hand.
Learn more →Any modern AI agent
Support bots, ops automations, internal research assistants. If it can read a context file, it reads the same ontology your analytics runs on. No per-agent re-mapping. No definition drift.
Open standards. Version-controlled. Governed. Your ontology is an asset, not a vendor integration.
Pricing Plans
Choose the plan that fits your needs
- 1 admin account
- Up to 5 user accounts
- 1 data source connection
- Ontology builder
- Advanced AI insights
- 10 questions per month
- Community support
- Up to 5 admin accounts
- Up to 50 user accounts
- Unlimited data sources
- Ontology builder
- Advanced AI insights
- Scheduled reports
- Slack integration
- Priority support
- Unlimited admin accounts
- Unlimited user accounts
- Everything in Pro
- Ontology builder
- Custom integrations
- SSO & advanced security
- Dedicated account manager
- SLA & extended priority support
Compare Plans & Features
| Feature | Free | Pro | Enterprise |
|---|---|---|---|
| Admin Accounts | 1 | Up to 5 | Unlimited |
| User Accounts | Up to 5 | Up to 50 | Unlimited |
| Data Sources | 1 | Unlimited | Unlimited |
| Ontology Builder | ✓ | ✓ | ✓ |
| Ontology Export | ✓ | ✓ | ✓ |
| Questions | 10/mo | 200 included, then €0.5 each200+ | Custom |
| Metric Queries | 100/mo | Unlimited | Unlimited |
| Entity Reports | 100/mo | Unlimited | Unlimited |
| Correlation Discovery | — | ✓ | ✓ |
| Access Policies & Row Filters | — | ✓ | ✓ |
| Scheduled Reports | — | ✓ | ✓ |
| Slack | — | ✓ | ✓ |
| Custom Integrations | — | — | ✓ |
| SSO & Security | — | — | ✓ |
| Support | Community | Priority | Dedicated + SLADedicated |
Frequently Asked Questions
What data sources does Magnowlia support?
Magnowlia connects to BigQuery, Snowflake, PostgreSQL, and Amazon Redshift. It also integrates with semantic layers including dbt Semantic Layer, Cube, and Steep. All connections support encryption via TLS and SSH tunneling for private networks. Additional SQL-based data sources can be added upon request.
Do I need to know SQL to use Magnowlia?
No. Magnowlia lets you ask questions in plain English. The AI generates SQL queries, executes them against your data sources, and returns results as interactive charts, tables, and written analysis.
How accurate are the AI-generated answers?
Every answer resolves against entities defined in your ontology — metrics, dimensions, relationships. The AI cannot reference a column you haven't mapped, and every number shows the definition, the assembled SQL, and the data it queried.
How does Magnowlia differ from traditional BI tools and semantic layers?
Traditional BI stops at dashboards. Traditional semantic layers stop at a metrics API for those dashboards. Magnowlia is built around an ontology you own: shared definitions, declarative governance, discovered correlations, and answers you can trust — reusable by every AI tool you deploy after us.
Do I have to build the ontology myself?
No. Magnus, our AI ontologist, seeds your ontology straight from your warehouse — tables, columns, and relationships become the starting point. From there, Magnus enhances it with your existing artefacts (dbt, Cube, data dictionaries in Excel, PDF, or Word) and proposes changes you review. Most teams go from empty repo to a working ontology in a single session.
How does access control work?
Who can see what — which metrics, which rows, which columns — is declared directly in your ontology. Rules apply to every AI query, metric lookup, and entity report, enforced server-side. Multi-region attributes (a user whose region is Germany, France, and Spain) and column masking (hashed, redacted, last-four) are supported out of the box.
Can Claude Code or other AI tools use my ontology?
Yes. Your ontology is a plain file built on open standards — commit it to the repo your engineers already work in, point Claude Code (or any coding agent) at it with a short instruction, and it generates application code that references your real metric definitions, inherits your access rules, and stays consistent with your analytics. No broker, no new infrastructure. See the full Claude Code use case →
Can I automate reports and share insights with my team?
Yes. Save any analysis as a project and schedule it to run daily, weekly, or monthly. Results are delivered automatically to Slack channels or direct messages, so your team gets fresh insights without manual effort.
Is there a free plan?
Yes. The free plan includes 1 data source connection, up to 5 user accounts, 10 AI questions per month, and advanced AI insights. No credit card required.
Is my data secure?
Yes. Magnowlia never stores your raw data. All connections are encrypted via TLS, with optional SSH tunneling for private networks. Credentials are stored in AWS Secrets Manager, and authentication uses AWS Cognito with support for SSO via Google, Okta, and Azure AD. SSO is available on the Enterprise plan.
Can multiple team members use Magnowlia at the same time?
Yes. The free plan supports up to 5 users, Pro supports up to 50, and Enterprise has no limit. Each user gets their own research threads and can collaborate through shared projects and scheduled reports.
What types of data visualizations does Magnowlia generate?
Magnowlia automatically selects the best chart type for your data. It supports bar charts, line charts, area charts, pie charts, scatter plots, heatmaps, sankey diagrams, and more -- including dual-axis and multi-series variations. Charts are interactive with zoom, pan, and selection.
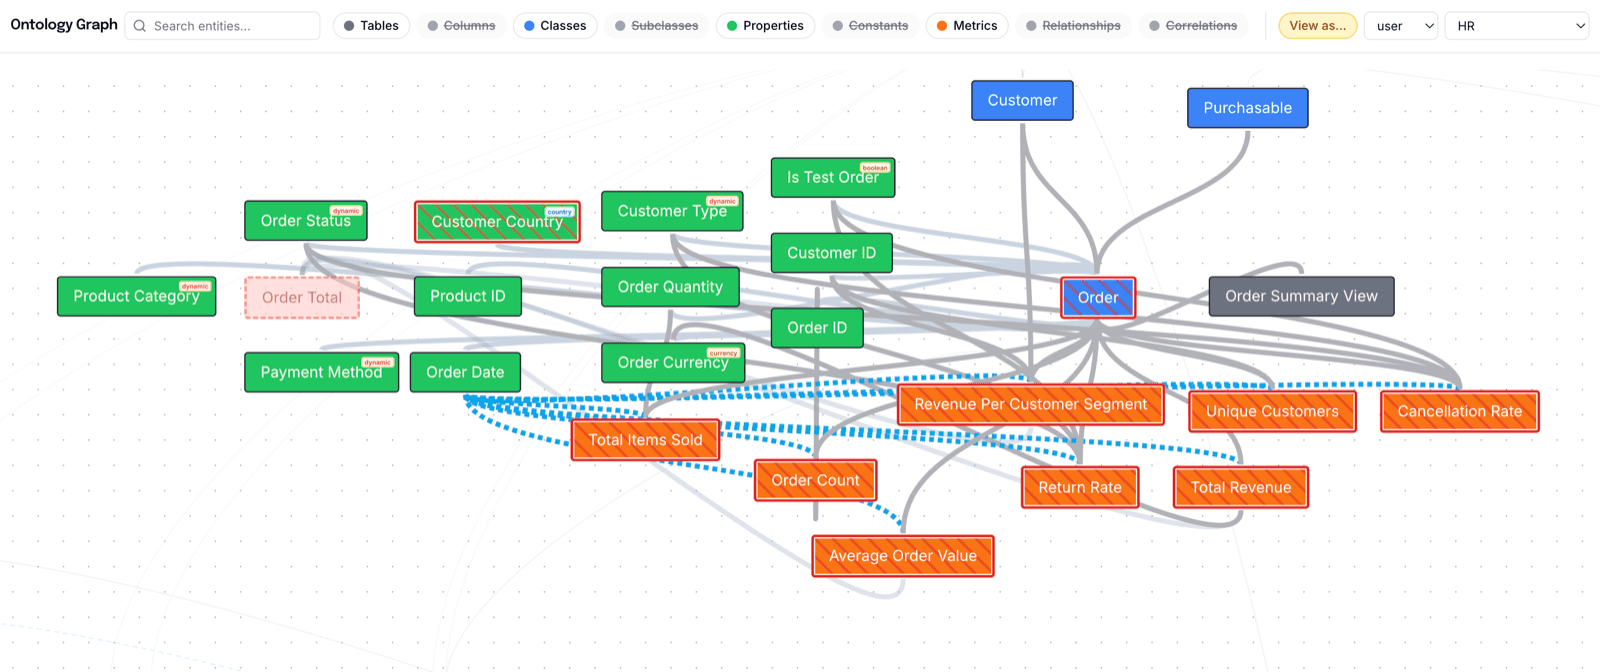
Can I visualize my ontology itself?
Yes. Magnowlia renders your ontology as an interactive graph — entities, metrics, relationships, and the access policies that govern them. Use it to audit what's defined, trace a metric back to its source tables, or see exactly what each user sees via the “View as…” mode.